In response to recent government reports on jobs and inflation, several people on social media have asked me to update my economic outlook for the United States. I am an economist of the people, and thus devote the present post to that purpose. (I also go through the material verbally on episode 317 of my personal podcast).
I’ll divide my analysis into three main areas: (1) consumer price inflation, (2) the labor market, and (3) whether the inverted yield curve still means a recession is imminent.
(Consumer Price) Inflation
Perhaps because they study natural resources, economists are the best gaslighters around. When it comes to the annual rate of increase of the Consumer Price Index—what most American pundits mean by “inflation”—here are the raw facts: In the beginning of 2020, as the world moved into the Covid panic, CPI inflation collapsed to nearly zero, while the Fed slashed short-term interest rates to (basically) zero and injected an unprecedented wave of new reserves into the financial system (by expanding its balance sheet).
But the yr/yr growth in CPI bottomed out by the summer of 2020 and began rapidly climbing. Various Keynesian pundits kept assuring Americans that this inflation was “transitory,” and they kept having to move their goalposts as the rise continued unabated. For example, in June 2021 Paul Krugman said inflation was a “blip” that would soon be over. Now when Krugman wrote that, the CPI was only 5.3% higher than the prior year. Yet the annual growth in CPI would blow past that ceiling, and didn’t peak until a year later when it was just about 9%.
Now through this period, the “Team Transitory” economists and policy wonks were urging the Fed not to hike rates too aggressively, because this would send the US into recession and was (they claimed) totally unnecessary; after all, the highest inflation in 40 years was due to bottlenecks from the pandemic, so why tighten monetary policy? But the Fed ignored their advice and began raising rates quite rapidly (in early 2022).
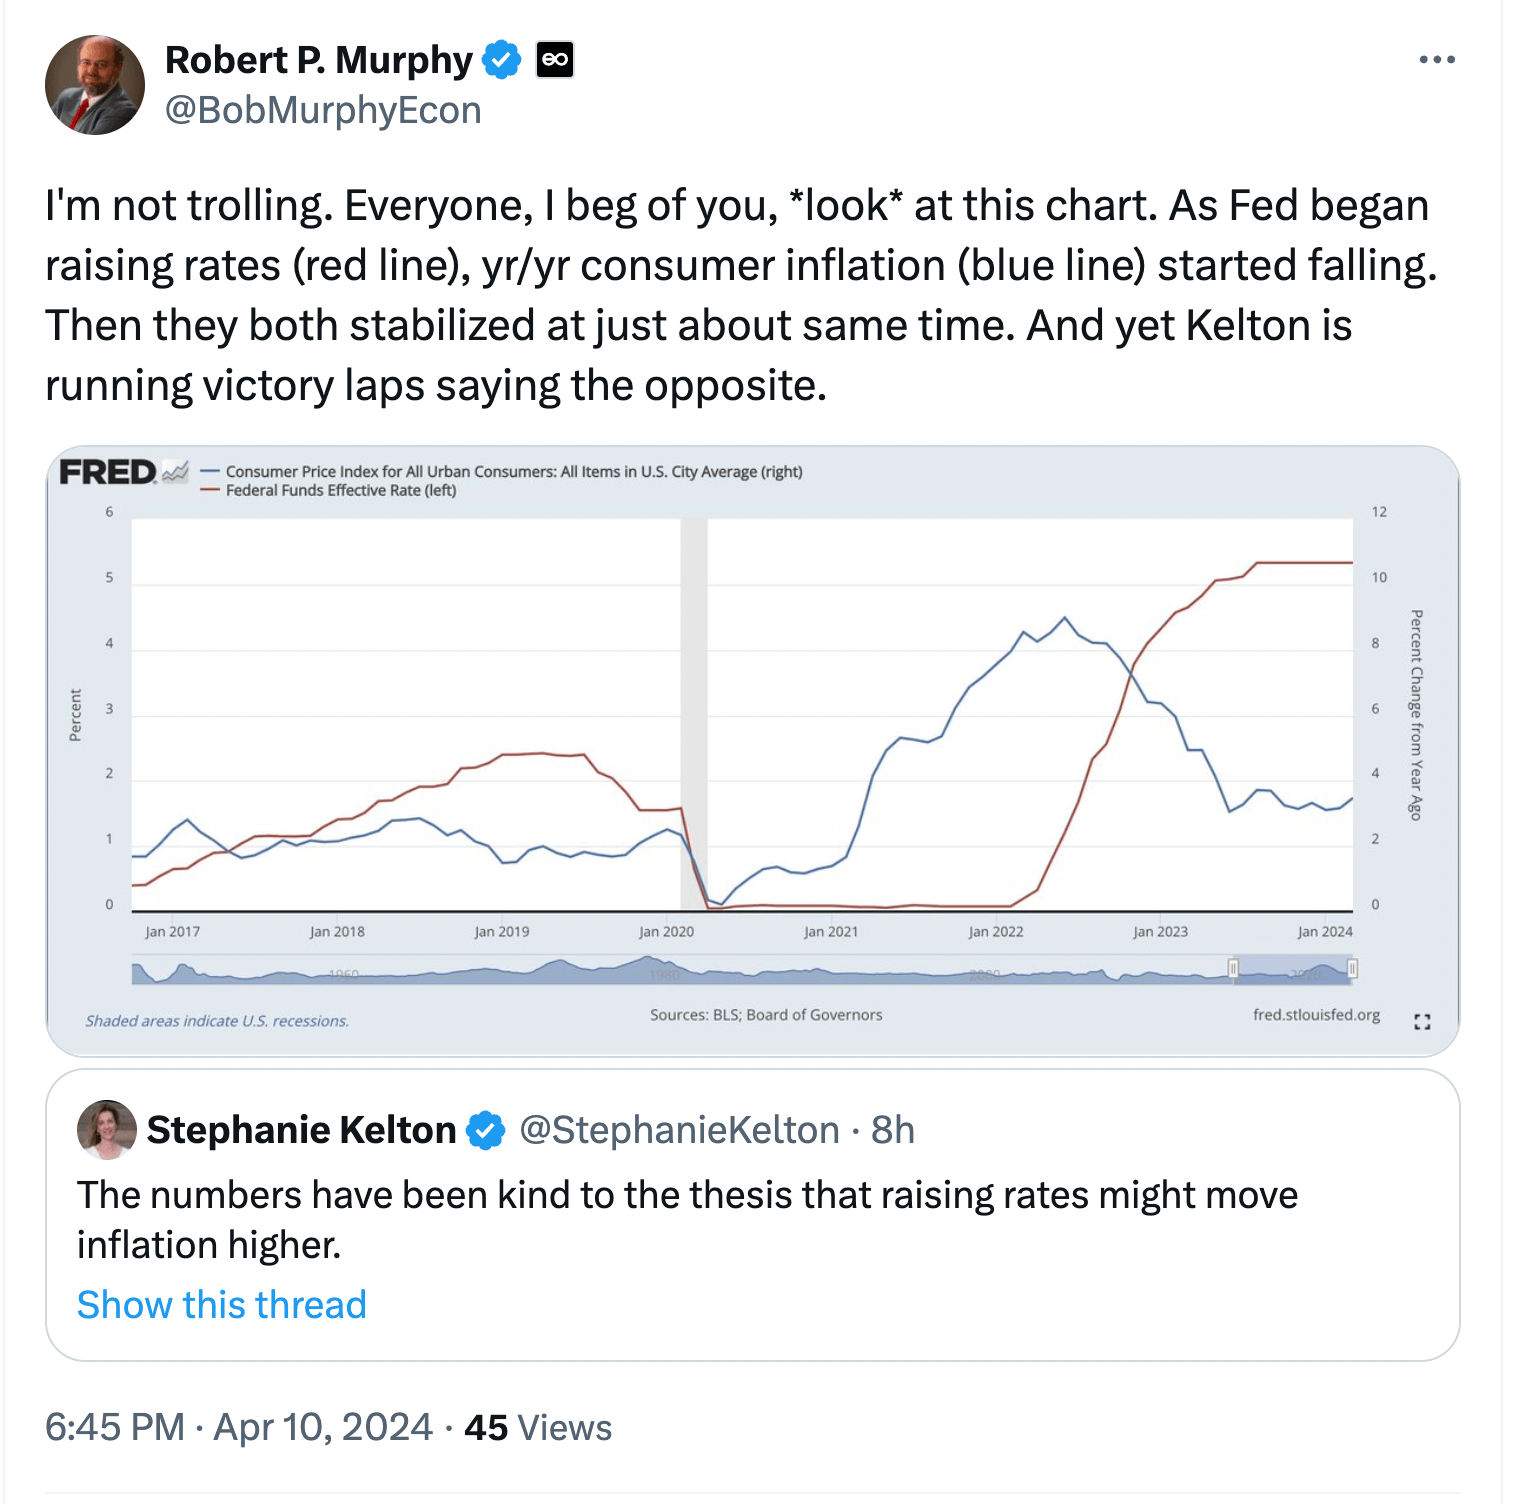
Now that the dust has settled, where the Fed jacked up rates in defiance of the “doves” and CPI inflation came rapidly down, the economic gaslighting has begun: You’ve got the conventional Keynesians like Krugman and Alan Blinder saying the Fed hikes had nothing to do with the falling inflation, while on the other hand, the Modern Monetary Theory (MMT) folks are saying that the Fed rate hikes made inflation higher. The following screenshot of my Twitter exchange with MMT guru Stephanie Kelton illustrates our differing approaches to data:
Now, let me try to avoid possible misunderstandings: I am not saying that CPI inflation mechanically moves the opposite way of short-term interest rates. The actual connection between the two is more nuanced. Really what’s going on is that, in a typical scenario where the Fed wants to “loosen” monetary policy, it pumps in more reserves to the banking system (through buying additional assets), which pushes down the market-clearing rate to borrow those reserves overnight. (This is the “federal funds rate.”)
On the other hand, if the Fed wants to “tighten,” it slows the infusion of new reserves, or even sucks them out of the system, by reducing the growth of its balance sheet or even letting it shrink. In conjunction with commercial bank lending, these Fed policies can influence the total quantity of money held by the public.
Now since the financial crisis of 2008, there is an extra complication, where the Fed can affect short-term interest rates by changing the rate it pays on reserves that banks keep parked at the Fed. I explain this complication, as well as the standard textbook story from above, in my Understanding Money Mechanics book (available for free download here).
To sum up: In typical practice, when the Fed wants to tighten (in order to cool off price inflation), its actions tend to go hand in hand with rising interest rates. On the other hand, when the Fed wants to loosen, its action tend to go hand in hand with falling interest rates.
However, these are just correlations, rather than direct economic causal relations. In extreme cases, you can have very high inflation and interest rates—such as Weimar Germany or Zimbabwe. And if a country maintained strict adherence to the gold standard, with consumer prices staying roughly constant for decades at a time, then it would probably have very low (nominal) interest rates on bonds quoted in that currency, because there would be no inflation component for investors to worry about.
Let me wrap up my discussion of the US with the following chart, showing the rate of CPI growth and M2 (a popular monetary aggregate that includes checking and savings accounts, currency in circulation, and shares in money market mutual funds):
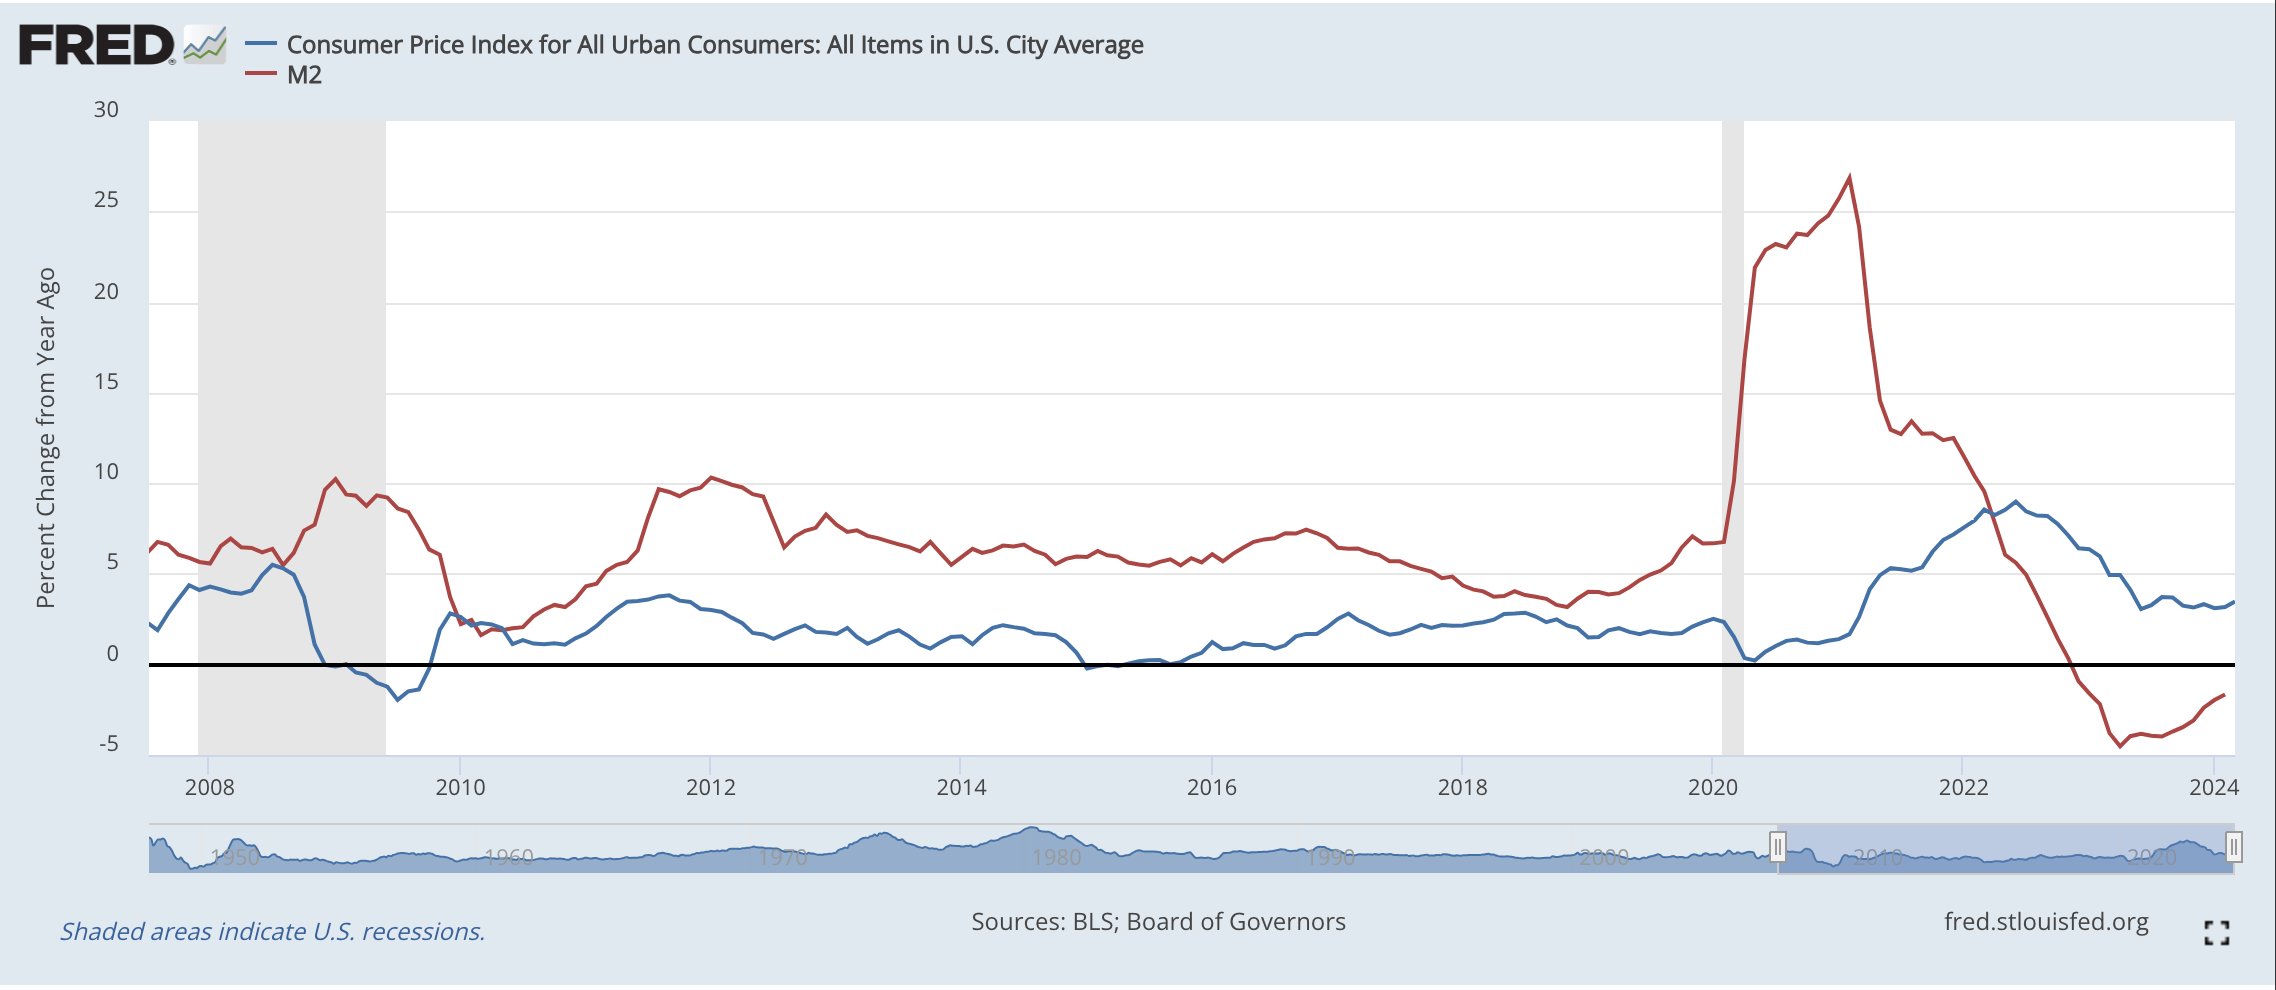
As the chart shows, in normal times M2 grows a bit above the CPI. This makes sense because there is always some “real growth” in the actual output of goods and services to absorb some of the extra money. (I’m speaking loosely.)
But going into the Covid panic, the Fed opened the spigots and M2 growth exploded, while people (locked in their homes) slowed their spending and prices stopped rising. But then—I would argue—we see that the Fed slammed the brakes on money growth, actually causing M2 to eventually shrink (when it goes into negative territory), which pulled CPI growth back down. The two lines even trough and bounce back up in a similar pattern near the end of the chart.
As of this writing, the Fed is still allowing its balance sheet to shrink (as its bonds mature and roll off), while the level of M2 has been roughly stable for the last year. Of course, if a tactical nuke goes off in Iran next Thursday, global oil prices would skyrocket. But there’s nothing embedded in the US financial system at the moment that leads me to expect a near-term surge of price inflation.
The US Labor Market
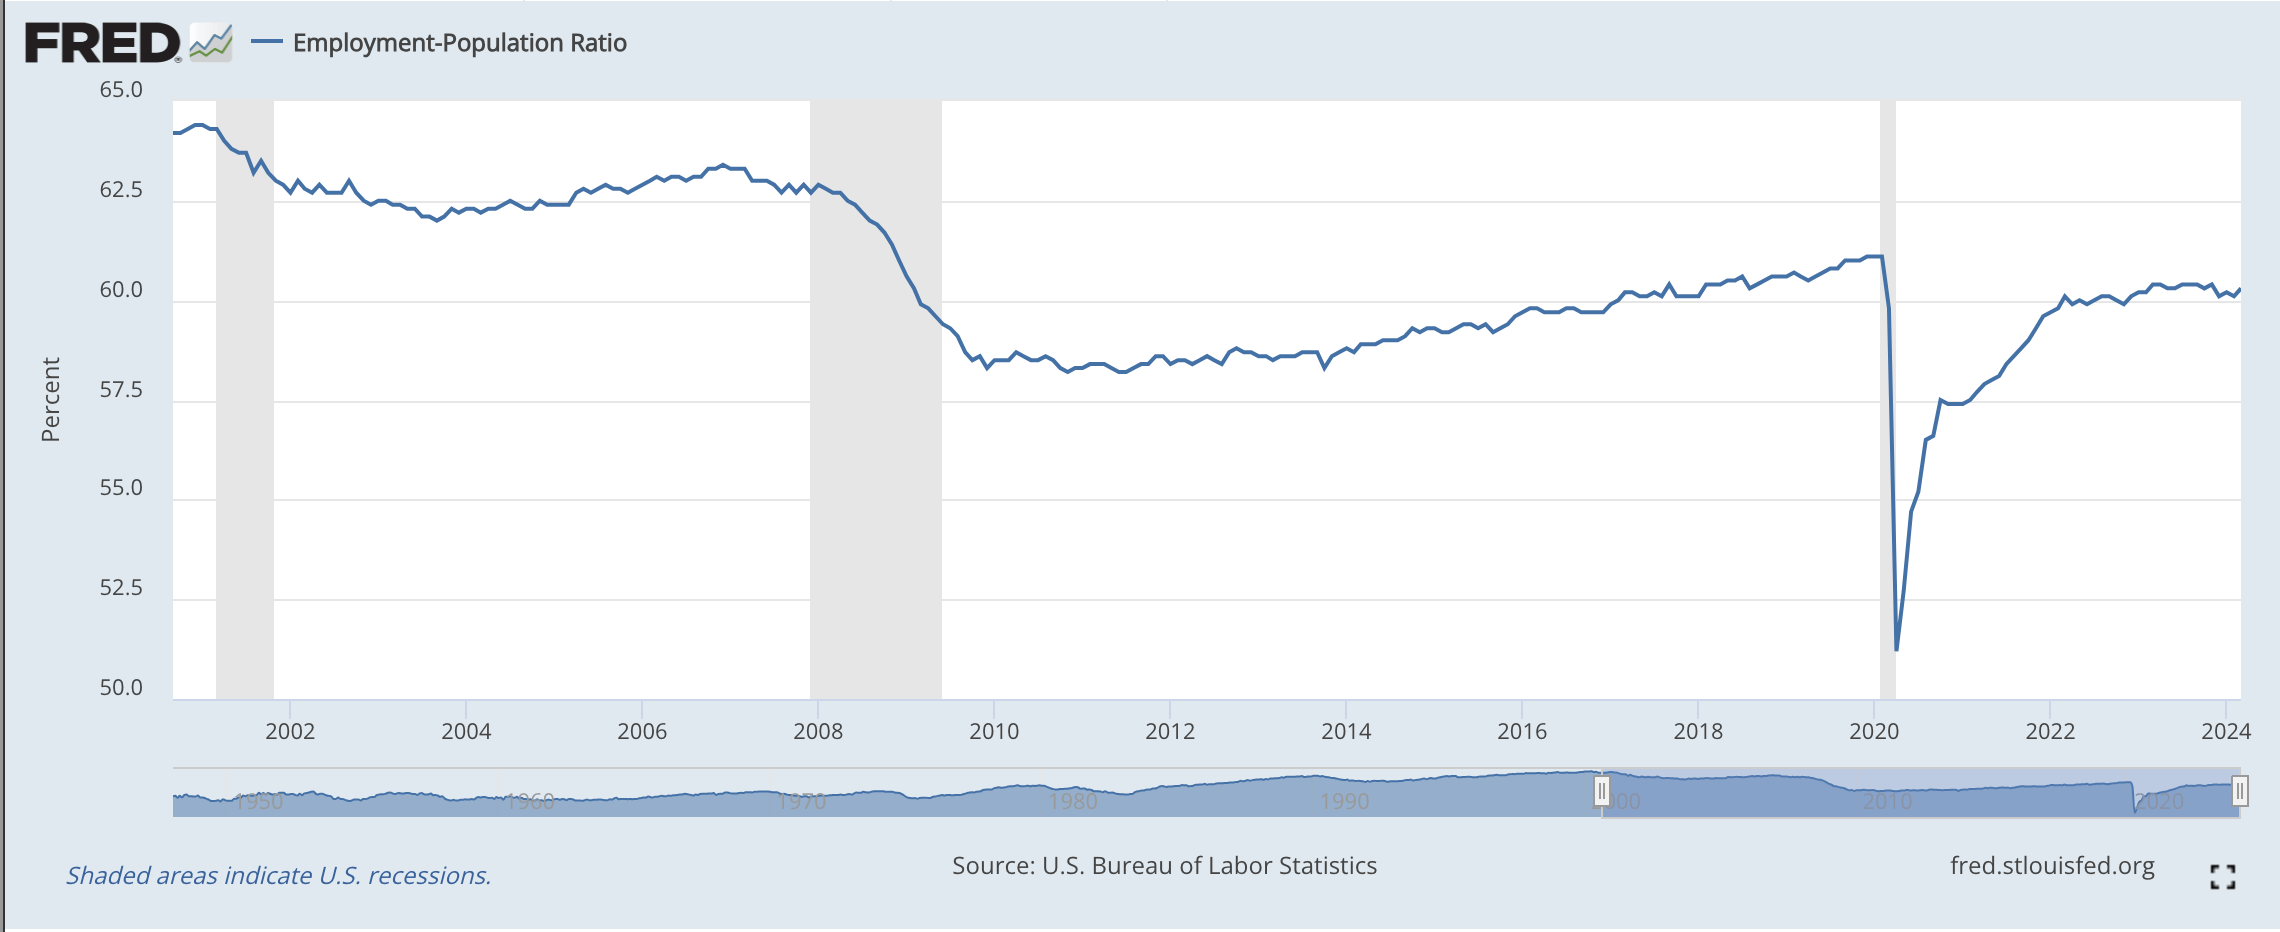
Although the unemployment rate is still quite low by historical standards, the fraction of the overall population who are working—what’s called the employment-population ratio—is almost a full percentage point below the pre-pandemic level. What’s more troubling, this statistic has been flat for a full year:
As the chart shows, in normal times M2 grows a bit above the CPI. This makes sense because there is always some “real growth” in the actual output of goods and services to absorb some of the extra money. (I’m speaking loosely.)
But going into the Covid panic, the Fed opened the spigots and M2 growth exploded, while people (locked in their homes) slowed their spending and prices stopped rising. But then—I would argue—we see that the Fed slammed the brakes on money growth, actually causing M2 to eventually shrink (when it goes into negative territory), which pulled CPI growth back down. The two lines even trough and bounce back up in a similar pattern near the end of the chart.
As of this writing, the Fed is still allowing its balance sheet to shrink (as its bonds mature and roll off), while the level of M2 has been roughly stable for the last year. Of course, if a tactical nuke goes off in Iran next Thursday, global oil prices would skyrocket. But there’s nothing embedded in the US financial system at the moment that leads me to expect a near-term surge of price inflation.
The US Labor Market
Although the unemployment rate is still quite low by historical standards, the fraction of the overall population who are working—what’s called the employment-population ratio—is almost a full percentage point below the pre-pandemic level. What’s more troubling, this statistic has been flat for a full year:
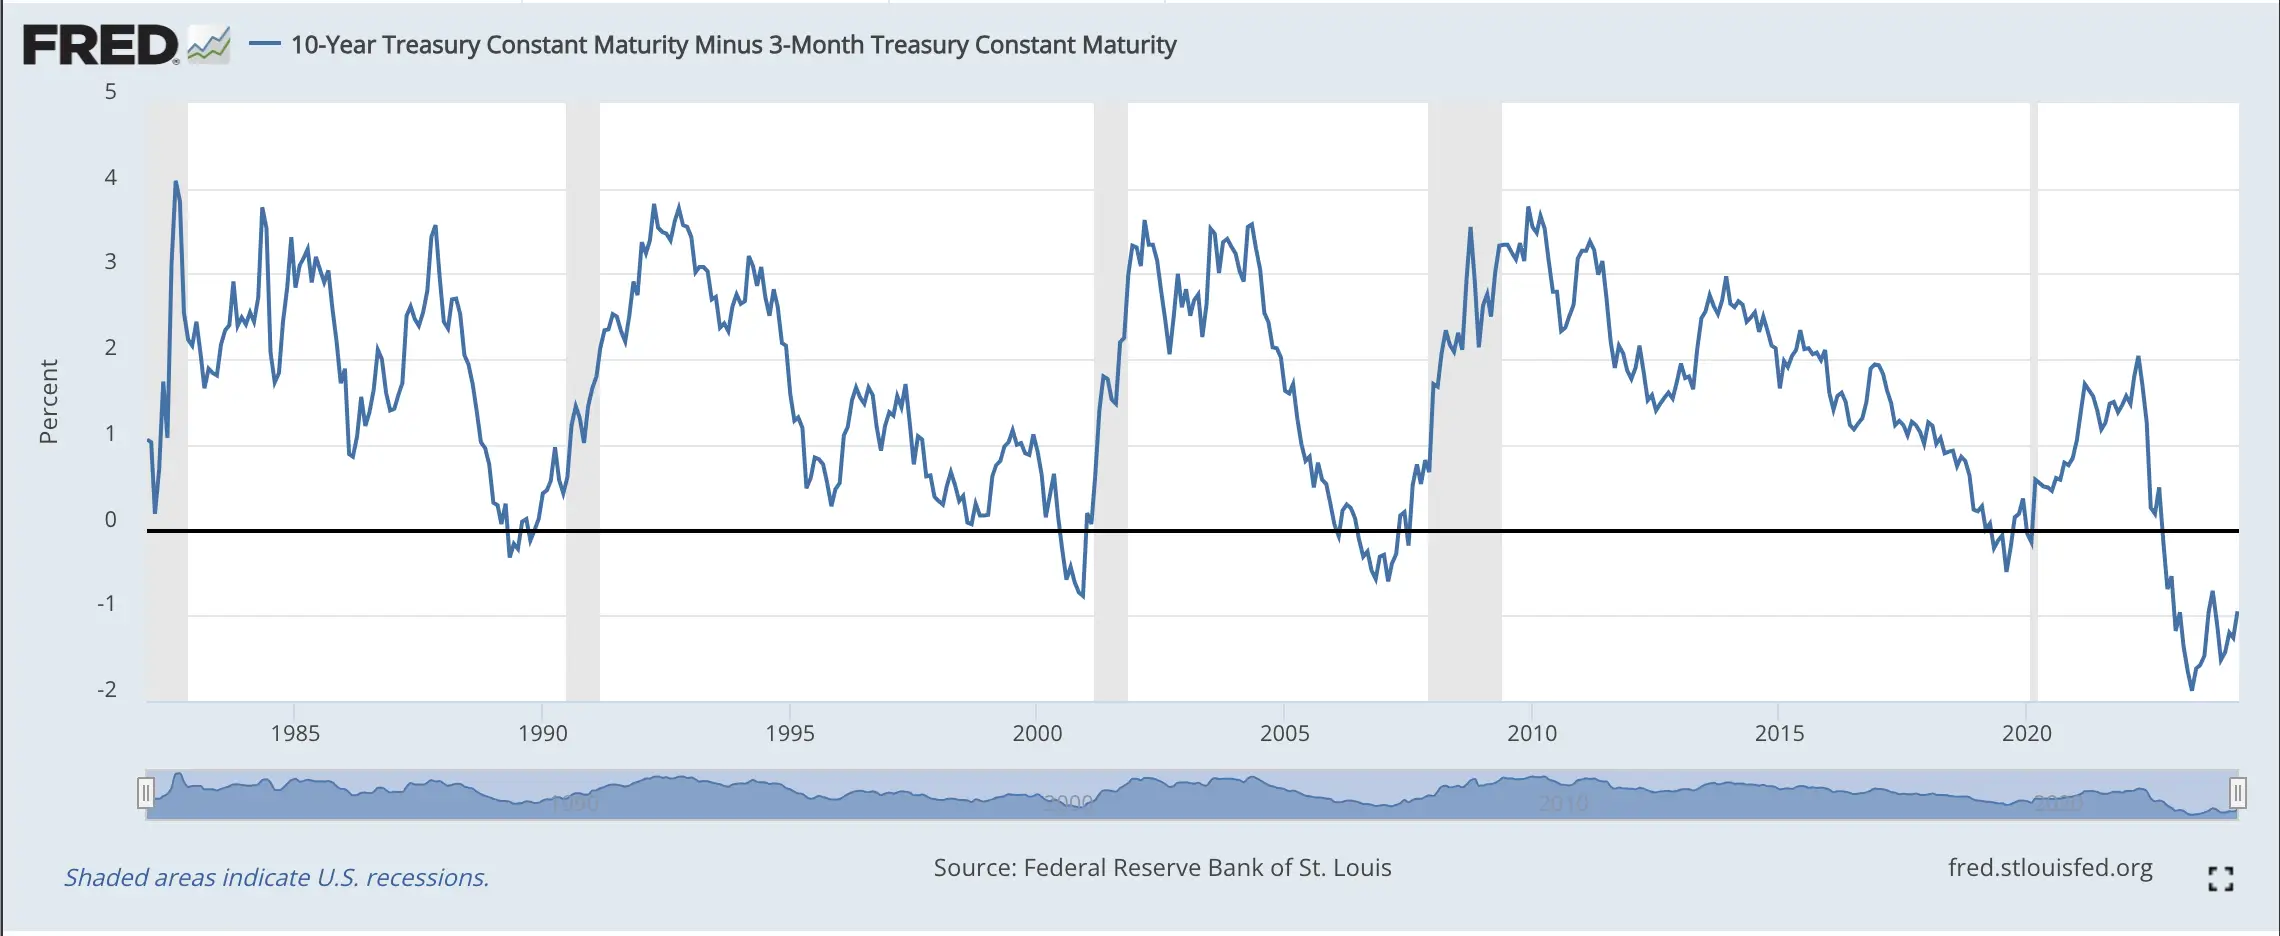
As the chart above showcases, the yield curve—defined here as the spread between the yields on 10-year and 3-month Treasuries—inverted shortly before each of the last four recessions, and it only inverted before them. (In other words, no false negatives or false positives.) But also notice how our current inversion refuses to quit. Does that mean we should stop expecting the “imminent” recession to occur as well?
To try to understand why our current inversion hasn’t snapped back, we can decompose the spread (shown above) into its constituent elements, namely by separately graphing the 10-year and 3-month Treasury yields:
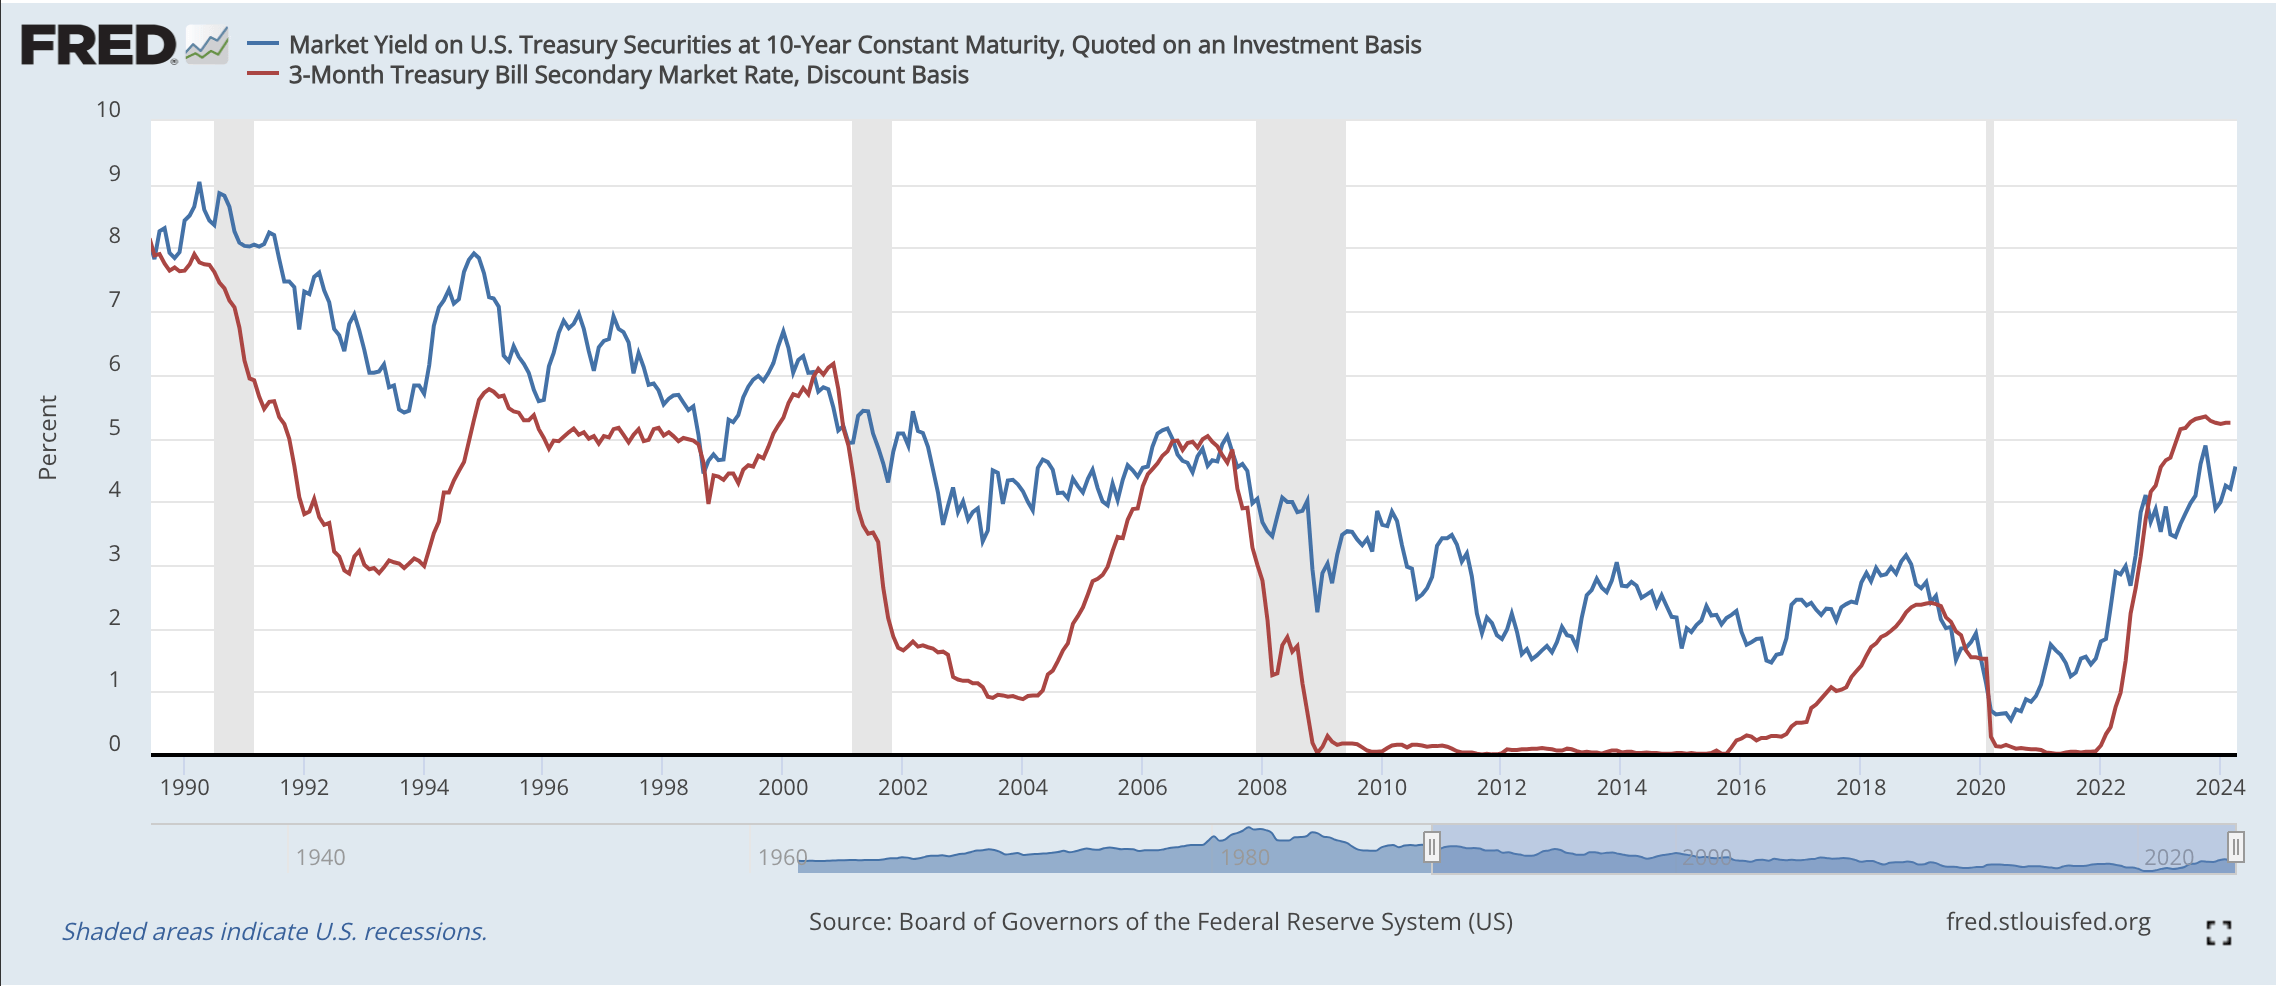
I won’t dwell on the above chart except to say this: I think what happened is that normally, the short rate (red line) shoots up when the Fed tightens, and briefly surpasses the long rate (blue line). Then either the red line starts dropping when the Fed begins cutting again, or (as in 2007, before the 2008 crisis) the two lines are quite close, and the blue line happens to poke its head back above the red. So in either situation, the initial inversion disappears, the yield curve goes back to “normal,” and then the recession soon ensues.
But in the present case, there was a such a large gap between the red and blue lines—caused by the aggressive Fed tightening—that even when 10-year yields spiked in late 2023, it wasn’t enough to make the yield curve return to upward-sloping.
In any event, if I’m right about the underlying mechanism for why yield curve inversions “signal” a recession, it all has to do with the short-term rate. The real issue is the Fed pushing short rates artificially low during a boom and then jacking them up, which leads to a crash. So the real question is, has the Fed’s recent tightening been dragging on for a long time, without us seeing tell-tale signs of a crashing economy?
Here the answer is “no.” Allow me to showcase one final chart in this article, showing the relation between the federal funds rate (the Fed’s “target rate”) and the unemployment rate:
![]()
If we compare our current situation the calm before the storm in late 2006 and 2007, there are eerie similarities. As the chart above indicates, back during the housing bubble years, the fed stopped hiking rates in July 2006, with the effective fed funds rate hitting 5.31%. The Fed didn’t start aggressively cutting until August 2007, at which point unemployment was still only 4.6%, a mere 0.2 percentage points higher than its trough the prior year. Just looking at the unemployment rate, it would not at all have been obvious as of the summer of 2007 that the greatest financial crisis since the 1930s was in store.
See how similar that situation is to our current one. The Fed stopped hiking rates in July 2023, when the effective rate was 5.33%. It has held them there since, while the unemployment rate troughed and is slowly drifting back up.
What’s the takeaway? Even if the Fed holds rates steady through May, June, and July, it would be perfectly consistent with what happened going into the global financial crisis. So therefore, the bulls shouldn’t be running victory laps early this summer merely because the Fed sees no immediate reason to cut. The inverted yield curve still looks like a good indicator, and I think it’s still flashing DANGER, WILL ROBINSON.
Conclusion
In light of the above, my current outlook for the US economy is that we’ve digested the major bursts of consumer price inflation (but of course global shocks could still cause certain prices to spike). Yet the labor market is still structurally broken, and the yield curve is warning of an impending crash.
NOTE: This article was released 24 hours earlier on the Infinite Banking (IB) 3.0 – The Future of Finance Group
Dr. Robert P. Murphy is the Chief Economist at infineo, bridging together Whole Life insurance policies and digital blockchain-based issuance.
Twitter: @infineogroup, @BobMurphyEcon
LinkedIn: infineo group, Robert Murphy
Youtube: infineogroup
To learn more about infineo, please visit the infineo website